Spectral Estimation FAQ
• Why you should use kSpectra?
For a given time series a common task is often to find recurrent features or periodicities. kSpectra provides a set of classical spectral analysis methods that are often complementary in terms of robustness versus resolution.
-
• What spectral methods are available in kSpectra?
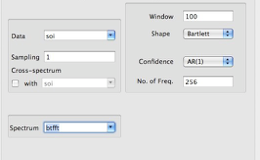
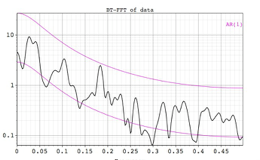
The Blackman-Tukey correlogram is the classical method for performing spectral analysis. The algorithm computes first the autocovariance of the data, then applies a window, and finally Fourier-transforms it to compute the spectrum. The main drawback is its poor resolution in the spectral domain: most of the time sharp features are considerably smoothed. This method is also used to estimate cross-spectrum between two time series.
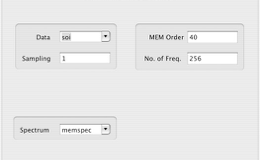
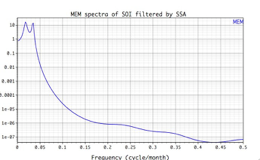
The Maximum Entropy method is known for its high resolution. Its main drawback is the appearance of spurious spectral lines. As in the Blackman-Tukey method, you have a trade-off between resolution and confidence. It can be very effectively applied to the time series de-noised by SSA.
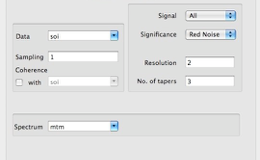
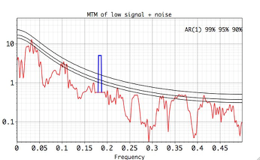
The Multitaper method offers some unique features: a high resolution and statistical confidence levels that are independent of the spectral power. In addition, contributions at selected frequencies can be reconstructed. Multitaper Harmonic Test and Coherence between two time series can be estimated as well.
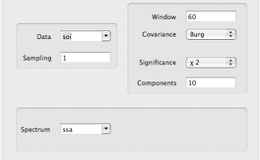
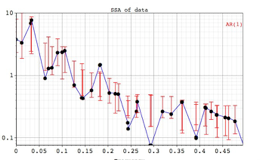
The Singular Spectrum Analysis (SSA) method represents the signal as a sum of components that are data adaptive functions. This novel technique can be used for spectral estimation, noise filtering and prediction of quasi-periodic components, as well as gap-filling. Multivariate data can be analyzed with Multi-channel SSA (MSSA) and Principal Component Analysis (PCA).
-
• Where is Fourier transform?
The Periodogram (Fourier transform) method is perhaps the most well known method for doing spectral analysis. The data (multiplied by a window to minimize spectral leakage) are just Fourier transformed. However, this method is not suitable for short and noisy data, because results are not stable with respect to small changes in the input signal.
Combination of kSpectra spectral methods provides powerful way to identify oscillatory modes in short and noisy time series; see examples included with your trial copy.
| ©2004-2020 by SpectraWorks. All rights reserved.|


